
Over the past several months, studies have indicated that COVID-19 has disproportionately impacted African American and Hispanic populations, as well as socioeconomically disadvantaged groups. A recent Sutter Health study showed that African Americans diagnosed with COVID-19 were 2.7 times more likely to be hospitalized compared to white patients [1]. Using data from the COVID Racial Tracker, an NPR study has also indicated that Hispanics are contracting COVID-19 at rates higher than would be expected given their population share, yet it is African Americans who are dying of COVID-19 at nearly twice the expected rate [2]. The racial disparities in disease and mortality outcomes are incompletely understood and warrant further study, as immediate efforts are needed to narrow this gap.
One of the hurdles to understanding these COVID-19 outcome disparities has been a lack of timely and complete data. The federal government has required that as of August 1st, diagnostic labs must report data on race and ethnicity to state and local health authorities. This requirement will increase the quality and availability of data but does not solve the immediate need for data to understand racial disparities in outcomes. In the interim, researchers can utilize already available real-world data to examine racial inequalities. Using the COVID-19 Research Database, we have confirmed previous findings posted by the NPR and Sutter Health teams. We leveraged three de-identified or limited data sets, which were connected using privacy-preserving record linkage to combine data elements necessary to understand disease impact by race and income:
- Mortality Data, which contains curated data from government agencies, online newspapers, funeral homes, online memorials, direct submissions, and other sources that collectively cover over 80% of annual U.S. deaths.
- Medical Claims Data, which contains patient demographics, diagnoses, procedures, service dates, and billing information (e.g., doctor, facility, and insurance carrier). The data set used contains > 3 billion claims on > 100 million unique patients over the last 7 years. The data set indicates whether a patient was diagnosed as COVID-19 positive by a physician. Source: Office Ally.
- Consumer Data, which includes a variety of consumer attributes on >240 million individuals across >120 million households. The attributes are drawn from publicly available data, surveys, and custom algorithms informed by cognitive psychology. The attributes are organized in three primary categories: People (e.g., demographics, finance, credit, housing, jobs, lifestyle), Behaviors (e.g., interests, charitable giving, healthy lifestyle), and Predictors (e.g., motivator, travel, auto, in-market, and economic stats). Only demographic and income data was assessed in this study. Source: AnalyticsIQ.
Study Findings on the Joined Dataset
The key elements utilized in the study were (i) fact of death, which was pulled from the mortality data set, (ii) the physician diagnosis information from the medical claims data, and (iii) the racial and income attributes drawn from the consumer data. Overall, there were 27,037,294 patients present in both the claims and consumer dataset. We narrowed our analysis to claims in 2020, resulting in 5,731,415 patients. Of these, 10,673 individuals had a positive COVID-19 diagnosis. In later analysis, we refer to this cohort as COVID-19 cases. 629 individuals had a positive COVID-19 diagnosis and fact of death, which we will subsequently refer to as a COVID-19 death. As explained in further detail in methodology and limitations, although we refer to this group as COVID-19 deaths, knowing that a COVID-19 diagnosed patient died (the “fact of death”) does not conclusively tell us the cause of death.
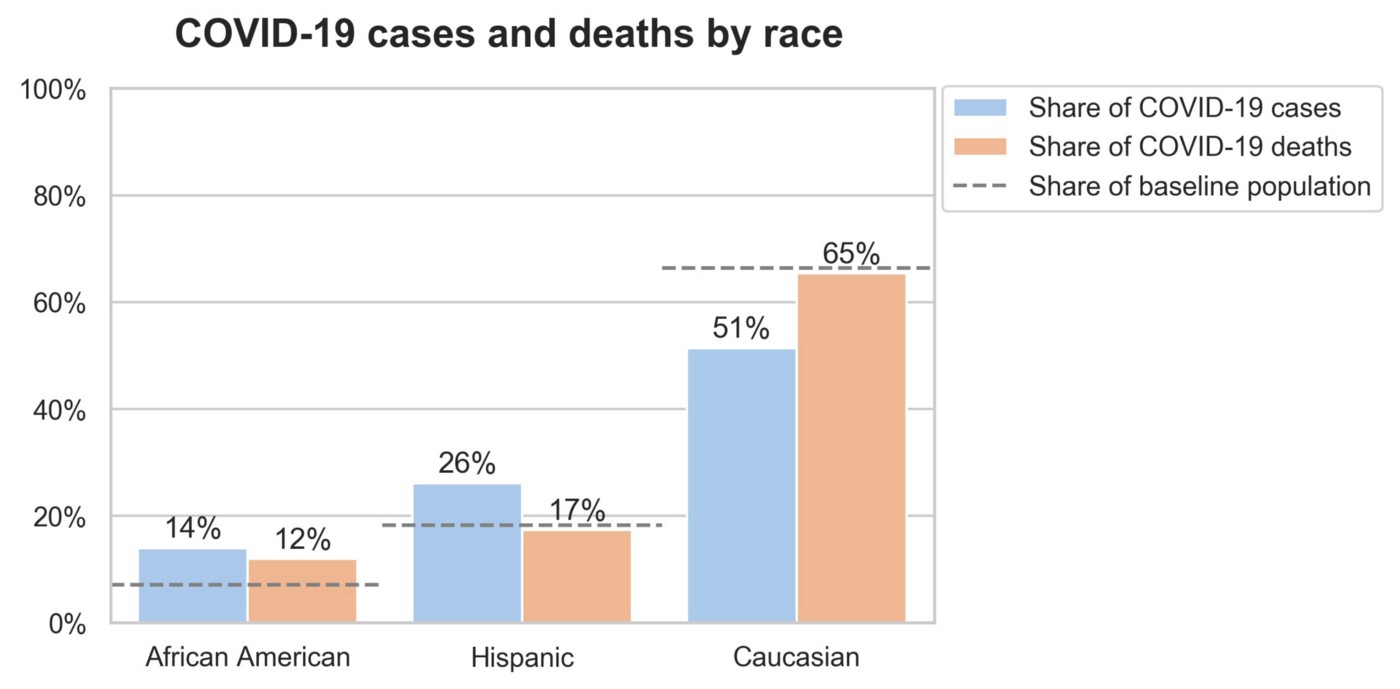
Diagnosis and Death Distributions by Race
In the combined dataset, we observed similar trends to those identified in the Sutter Health and NPR studies. By comparing the baseline distribution of race in our dataset to the distributions of COVID-19 cases and COVID-19 deaths, we see that African Americans and Hispanics make up a larger than expected share of both cases and deaths.
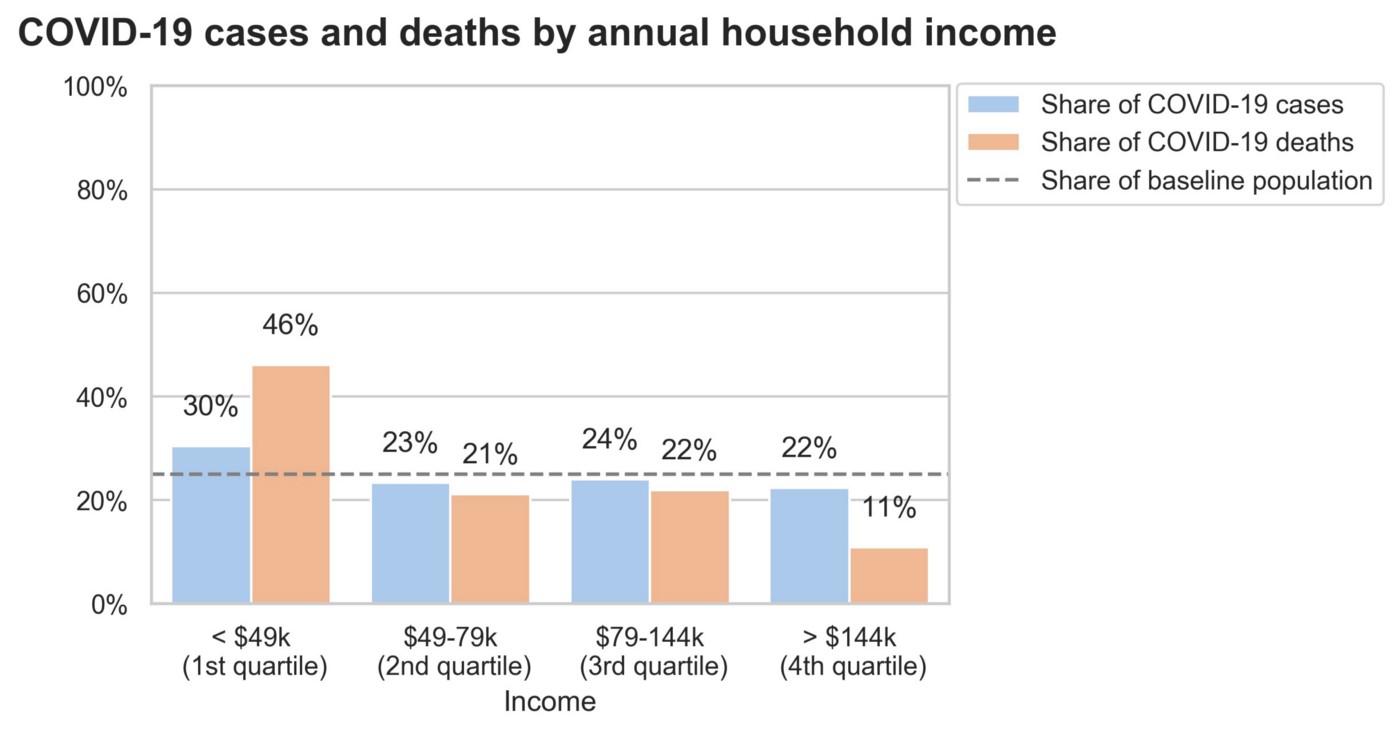
Diagnosis and Death Distributions by Income
The effect of income on health outcomes has been the focus of a number of studies over the years [3]. Inferring causation is challenging, but potential factors that might lead to disparate health outcomes by income include access to care and preventative medicine, improved living conditions, and access to education on healthy behaviors. With regard to COVID-19 in particular, it has been shown that low income individuals are 10% more likely to have a serious chronic health condition, which can make COVID-19 up to 10 times as deadly [4]. Preventive measures, such as avoiding public transportation and working from home, are also far more accessible to the rich, reducing their risk of a coronavirus diagnosis [5].
We observe these same trends in our analysis. Those in the first quartile (<$49k) annual household income bracket show higher than expected representation in both cases and deaths, and those in higher income brackets show lower than expected representation, particularly in deaths.
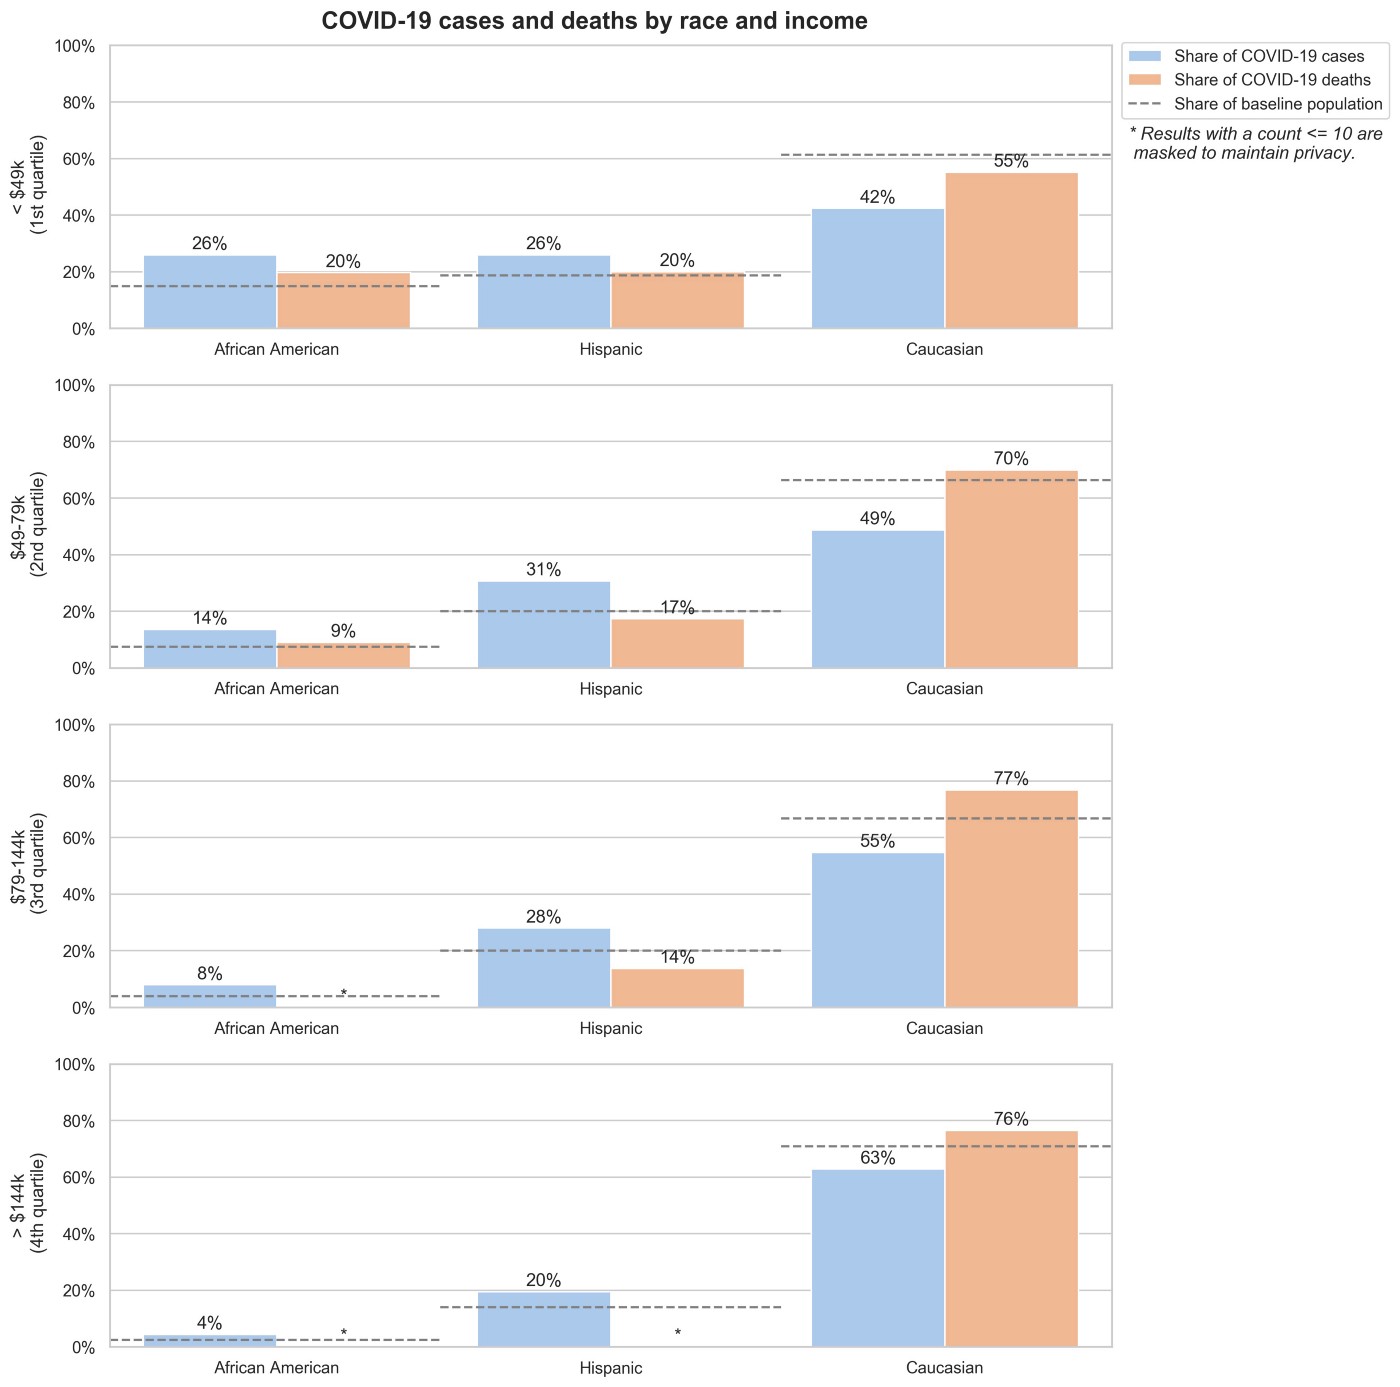
Diagnosis and Death Distributions by Race and Income
Unfortunately, in the United States, there is a strong correlation between income level and race, particularly for African American and Hispanic populations. According to the US Census Bureau, these populations have significantly lower median income levels than the overall US population [6]. After looking at the race and income data independently, we hypothesized that disparate impacts of COVID-19 would be stronger among low-income populations in vulnerable groups with social determinant factors that negatively impact health [7,8,9].
By analyzing racial groups within each income quartile, we can observe how they interact. Unsurprisingly, disparities by race are amplified in the lower income cohort. However, even in the higher income group, we still see higher case rates among African Americans and Hispanics, and lower case rates among Caucasians. Interestingly, we don’t observe the same trend for COVID-19 deaths. It warrants further research to determine whether these results are replicable across datasets, or are a result of high variance from a small cohort of COVID-19 deaths.
Methodology and Limitations
Methodology
Our approach to this study had several key components:
- Privacy-preserving linking: Data was joined with privacy-preserving linkage methods in a manner certified by a third-party expert as de-identified under HIPAA regulations. As part of that process, some elements which were present in the individual datasets were removed to maintain sufficient de-identification for the combined set. To preserve privacy, income levels were capped at $200K and age was capped at 80 (e.g., an 81 year old patient would be represented as 80).
- Matching: When joining the data, patients were considered the same if their identifiers, which represented unique combinations of last name, first name Soundex, date of birth, and sex, were identical. Some cleaning and standardization is applied on these fields. When one of these identifiers mapped to multiple races, death records, income groups, or education levels, that identifier and corresponding data was removed. Such cases occurred in approximately 10% of the data.
- COVID-19 Diagnosis and Fact of Death: Any claim with a U07.1 ICD10 code was considered a positive COVID-19 diagnosis. While the combined dataset includes the fact of death, it does not always contain the cause of death. Our analysis cannot conclude that a positive COVID-19 diagnosis and fact of death indicates a COVID-19 caused death.
- Modeled Consumer Attributes: The annual household income and race fields from the consumer data are partially modeled through proprietary methods based on surveys, demographic data, and other variables. This is a common practice in consumer datasets, but in this context is a limitation on the data compared to the reported demographic information that the government will begin mandating in August.
Limitations
Representativeness of Sample
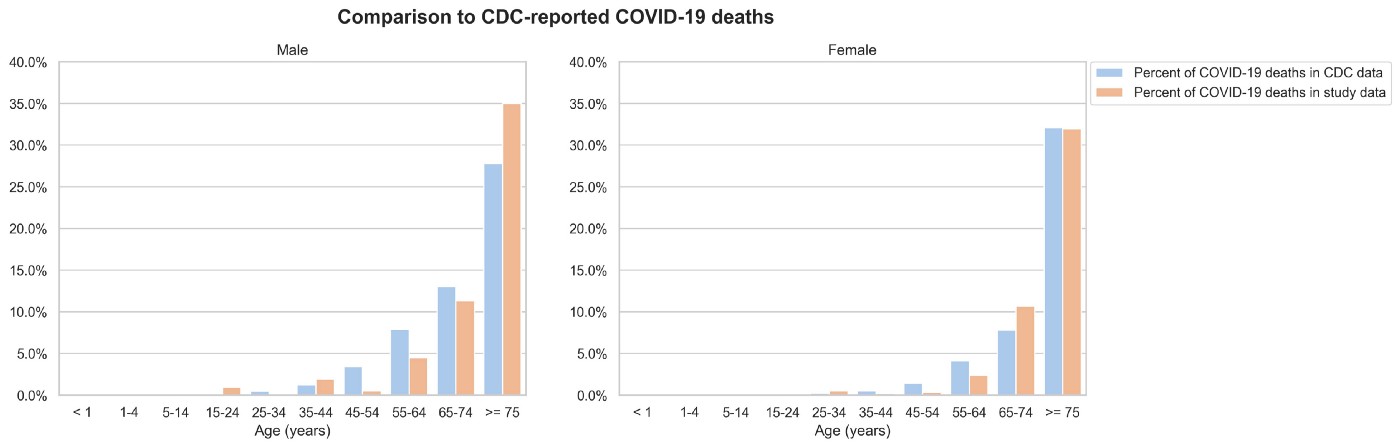
The joined data is not a representative sample of the U.S. population, which is why we compare the percentage of COVID-19 diagnoses and deaths to the baseline percentages in the underlying dataset rather than to the U.S. population. Each dataset only covers a subset of the U.S. population, and fluctuates across age, sex, geography, and other variables.
To sanity check the data used, we compared certain baseline percentages in our data with the data published by the CDC (conducted 2020/06/04). While we observed significant alignment, this does not imply representativeness.
Geographically, the medical claims data we used in this analysis has better coverage along the West Coast (CA, OR, WA), both by proportion of those states’ populations and proportion of our dataset. California alone makes up a fourth of our sample. Per our mortality source, the coverage in our most represented areas is approximately 75% of all deaths, and coverage may also vary across income levels.
Matching
When matching, patient information discrepancies across datasets (e.g., a date of birth in the consumer data mismatching the date of birth on a medical claim) lead to false negatives, and collisions in information, though unlikely, lead to false positives. These mismatches are not randomly distributed throughout the population. While it is difficult to verify matching accuracy due to the de-identified nature of the data, previous internal evaluations on comparable data sets suggest a precision of 95% and a recall of 90%.
Latency
Reporting latency on claims and death data also vary. Both may be received weeks after an encounter. For a particular service, it may take two months for 80% of claims to be processed and appear in the data. The mortality data, which covers over 80% of the population, takes approximately a month to capture 90% of the deaths that will eventually be included.
Additional Limitations
Omission from mortality data does not imply that an individual is alive, only that the fact of death was not captured in that dataset. We do not consider diagnoses outside of the U07.1 ICD10 code in the medical claims, and so, like mortality data, a lack of positive COVID-19 diagnosis in the medical claims data does not imply the individual does not have COVID-19.
Consumer data may have bias related to survey and modelling methods. Most of the consumer data we used was at least partially modelled.
Each of these factors imparts a bias into the dataset, and generalization of results would be inappropriate without replication of these findings and further analysis.
Next Steps
As next steps, we’re interested in diving more deeply into income and race conditional on location, age, sex, and comorbidities, as well as conducting more advanced survival analysis on these subgroups.
This joined dataset is available as part of the COVID-19 Research Database. We encourage researchers to submit proposals to the database to verify and expand upon our findings, as well as to conduct further investigation into both this topic and others.
Contributors
The COVID-19 Research Database is a pro-bono, public-private, cross-industry collaboration composed of institutions donating technology service, healthcare expertise, and limited and de-identified data. The database is a public-private consortium organized by Datavant, Health Care Cost Institute, Medidata, Mirador Analytics, Veradigm, Change Healthcare, Symphony Health, Snowflake and many others.
AnalyticsIQ is a leading predictive data and analytics innovator that leverages a blend of publicly available data and custom algorithms informed by cognitive psychology concepts to describe consumers across three areas — People, Behaviors, and Predictors. Headquartered in Atlanta and recently named one of Georgia’s Top 10 most innovative companies, AnalyticsIQ’s team of data analysts, scientists, and cognitive psychologists have over 100 years of collective analytical experience and expertise.
Office Ally is a full-service medical claims clearinghouse that provides numerous software products to empower both doctors and patients.
Citations
[1] https://www.healthaffairs.org/doi/full/10.1377/hlthaff.2020.00598
[4] https://www.nytimes.com/2020/03/15/world/europe/coronavirus-inequality.html
[5] https://qz.com/1818862/coronavirus-prevention-is-far-more-accessible-for-the-rich/
[6] https://www.census.gov/content/dam/Census/library/visualizations/2018/demo/p60-263/figure1.pdf
[7] French DD, Wang A, Prager AJ, Margo CE. Association of the Robert Wood Johnson Foundations’ Social Determinants of Health and Medicare Ocular Hospitalizations: A Cross Sectional Data Analysis. Ophthalmol Ther .2019 Dec;8(4):611–622. doi: 10.1007/s40123–019–00220–1. Epub 2019 Nov 1.
[8] Wang A, Kho AN, French DD. Association of the Robert Wood Johnson Foundations’ Social Determinants of Health and Medicare Hospitalisations for Ischaemic Strokes: A Cross-Sectional Data Analysis. Open Heart. 2020 Jan 8;7(1):e001189. doi: 10.1136/openhrt-2019–001189. eCollection 2020.
[9] French DD, Behrens JJ, Jackson KL, Kho AN, Walunas TL, Evans CT, Mbagwu M, Margo CE, Bryar PJ. Payment Reform Needed to Address Health Disparities of Undiagnosed Diabetic Retinopathy in the City of Chicago. Ophthalmol Ther. 2017 Jun;6(1):123–131. doi:10.1007/s40123–016–0072–4. Epub 2016 Nov 24.
Further Evidence that COVID-19 Disproportionately Impacts African American, Hispanic, and Low-Income Populations was originally published on Medium, where people are continuing the conversation by highlighting and responding to this story.


.svg)